ENGG1811 Lab 09: File handling, numpy
Objectives
After completing this lab, students should be able to:
- Read files and extract data from them
- Use numpy broadcasting
- Selecting elements in a numpy array using the colon notation, the
double colon notation and Boolean indexing
- Use numpy to do data analysis
Assessment
This lab has three parts: Parts A to C. You need to show your tutors all
three parts.
For all the programs, we expect that you choose informative variable
names and document your program.
There is also an online
multiple choice question which is worth 1 mark. We suggest that you
attempt this question after completing Parts A-C.
Organising your work
You should make a directory called lab09 to store your files for this
lab.
Part A: File handling
The aim of the exercise is to practice using Python to read data files.
For this exercise, you need to download the zip-file lab09A.zip
[Note: right click to download] and move it into the directory lab09
that you created. This file contains 30 files zipped together. If you
unzip this file on a Windows or an Apple machine, the computer will create
a directory called lab09A within the directory lab09.
(In case you are doing your lab by remotely logging into a CSE computer
using Vlab, these instructions on this page
will apply to you. Note that the instructions were written assuming lab09,
but you should still be able to follow.)
If you use your file explorer (on Windows) or finder (on Apple), you
should find 30 files in the directory lab09A. These files have names
temp00.txt, temp01.txt, temp02.txt, ..., temp29.txt. All these 30 files
have the same format. If you double click on a file, a text editor window
will pop up and you will be able to see the contents of the file. You need
to take care not to edit the files because you do not wish to change the
format of the file. The contents of temp00.txt are:
A 4
23.31 20.89 27.04
27.50 29.70
The contents of temp01.txt are:
B 2
29.65 25.46 29.44
21.81 28.75
The format of the files are:
- Each file contains two lines.
- The first line contains a letter and an integer separated by a tab.
The letter can be either A or B. The integer has a value between 2 and
5, inclusively.
- The second line has five floating point numbers separated by tabs.
We ask you to write a Python program, with the name file_proc.py,
whose task is to read in these files and then use their contents to:
- Determine the number of files that has the letter A
in it
- Compute a numpy array of float type with 30 entries. We will refer to
this array as mean_data.
- The entry mean_data[0]
is determined from the contents of temp00.txt. Similarly, mean_data[1]
is determined from the contents of temp01.txt and so on.
- In order to compute mean_data[0],
you first look up the integer in the first line of the corresponding
file temp00.txt which is 4 in this case. The value of mean_data[0]
is the mean of the first 4 numbers (i.e. 23.31, 20.89, 27.04, 27.50)
in the second line of the file.
- Similar, in order to compute mean_data[1],
you first look up the integer in the first line of temp01.txt which is
2 in this case. The value of mean_data[1]
is the mean of the first 2 numbers (i.e. 29.65, 25.46) in the second
line of the file.
- Other entries of mean_data
are determined in the same way.
Note that you will need to put your Python file file_proc.py
in the directory lab09A so that it can read the files temp00.txt,
temp01.txt etc. This is because, by default, a Python program will look
for files in the directory that it is in. However, it is possible to put
the Python program file in one directory and the data files in a different
directory. If you want to learn how to do this, you can consult this
text, in particular Section 11.2.
If you want to check some answers for this question, see here.
Hints:
- For this exercise, you will need to open a number of similarly named
files one after another, you can use a loop and update the string
filename every iteration. You can get some idea from the
write_file_ex_final.py example in Week 8B's lecture.
- Note that the numbering of the filenames is 00, 01, .., 09, 10, 11
etc. It means that you need to pad a zero when the index is a single
digit number. You can use a if-statement to handle that.
- You can find some examples on reading files in file_read.py that we
discussed in the lecture.
Part B: numpy computation
This exercise is based on the Python file distance.py.
We suggest that you download the file distance.py and open it in Spyder
because it will make it easier for you to follow the description
below.
The Python file distance.py
defines two numpy arrays with the name pos
and ref. The array
pos has a shape of
(6,2). You can consider each row of pos
is used to store the position of an object. For example, pos[0,0]
and pos[0,1]
store, respectively, the x- and y-coordinates of the first object.
The array elements ref[0]
and ref[1] store,
respectively, the x- and y-coordinates of a reference point.
Your task is to compute the distance between each of the 6
objects in pos
from the reference point. If the co-ordinates of the object is (x,y) and
those of the reference point are (a,b), then their distance is given by
the formula:

We require that you complete this task using numpy functions and
arithmetic operators. You are not allowed to use any loops. You
can also find the expected answers in the file distance.py.
Hints: You will need to use numpy broadcasting discussed in Week
7A's lecture and some numpy mathematical functions (link
to numpy manual page on maths functions)
Part C: numpy data analysis
In Part B of Week 7's lab, you used numpy to analyse the data on the sea
ice extent. In this exercise, you will use the same data set to perform
some additional data analysis using numpy.
You will need to download these two files: sea_ice.txt
(the data file, which was also used in Week 7) and sea_ice_lab09.py
which is the Python file that you will use to complete this exercise.
The existing code in sea_ice_lab09.py does exactly the same preliminary
processing on the data in sea_ice.txt that we asked you to do in Week 7.
You had to type the code yourselves in Week 7 but we have done it for you
this time. If you run the existing code in sea_ice_lab09.py, it will
create three numpy arrays and plot a graph. The numpy arrays created are:
years, months,
data_sea_ice. Some
information that you need to know are:
- The data set contains data that began in year 1979 and ended in 2013,
i.e. over 35 years. The numpy arrays years
is [1979, 1980, ... , 2013].
- For each year, 24 measurements were made at half-monthly interval. The
numpy array months
is [0.5, 1, 1.5, ..., 12] which has 24 elements.
- The measured sea ice extent is stored in the 2-dimensional numpy array
data_sea_ice
whose shape is (35,24). Each row of data_sea_ice
contains the 24 half-monthly measurements taken over a year. For
example, the element data_sea_ice[2,5]
contains the sea-ice extend in Year 1981 (=
years[2]) at Month 3 (=
months[5]).
The graph plotted by sea_ice_lab09.py contains 35 curves which show the
annual variation of sea ice extent. You can see that the sea ice extent is
larger in the beginning of the year (which corresponds to the Northern
winter) than the later part of the year.
The following is a number of questions on the data set which you should
answer using numpy. There is a restriction that you must not use
any loops in your answer. If you want to check your answers, some of them
are on this page.
- Compute the mean sea ice extent using all the measurements in years
1987 to 1999 inclusively. There are multiple methods to do this but we
ask you to use Boolean indexing.
- Note: You will be using 13 years of data, so you will be averaging
13 x 24 measurements.
- Compute the mean sea ice extent using all the data in the last 3
months of all the years in the data set. We would like you to use two
different methods to answer this question. The first method is to use
the colon (:) notation to select the appropriate columns and the second
one is to use Boolean indexing. Both methods should give you the same
answer. If you get the answer 10.663 or 9.477, then something is
incorrect.
- Note: You will be using 35 years of data and 6 measurements per
year, so you will be averaging 35 x 6 measurements.
- Compute the mean sea ice extent using all the data in the first 6
months of the years 2000-2009 inclusively. We ask you to do it with
Boolean indexing.
- Note: You will be using 10 years of data and 12 measurements per
year, so you will be averaging 10 x 12 measurements.
- Hint: For this question, you will need to select some rows and some
columns. The numpy function ix_(), which was discussed in Week 7A's
lecture in the file numpy_slicing_2.py, will be useful.
- The 2-dimensional array data_sea_ice
contains half-monthly data, but you want to work with monthly data. You
want to obtain a 2-dimensional array sea_ice_monthly
which contains monthly data. The matrix should have 35 rows and
12 columns. Column 1 contains the average of the two measurements in
January, Column 2 for February, etc. The problem is to compute sea_ice_monthly
from data_sea_ice
without using any loops. This question is identical to Question 8 in
Week 7's lab on sea ice. You were asked to use the reshape
function in that exercise. In this question, we ask you to use the
double colon (::) notation to select the correct columns.
- Hint: You will need to form two sub-arrays by selecting the
appropriate columns. One sub-array has the columns corresponding to
months 0.5, 1.5, 2.5, ... 11.5. The other sub-array has the columns
corresponding to months 1, 2, 3, ..., 12.
- The double colon notation was discussed in numpy_slicing_1.py
- What is the largest decrease
in sea ice extent between two consecutive half-monthly measurements?
- It is not possible to directly use the array
data_sea_ice to answer this question. This is because it is
not easy to compute the difference between the sea ice extents in the
second half of December (last column of data) and first half of
January (first column of data). It is easier if the half-monthly data
are arranged chronologically in a 1-dimensional array. In numpy, the
process of turning a 2-dimensional array into a 1-dimensional array is
call "ravel" which we discuss in Week 5B's lecture.
The "ravelled" array will be useful for answering this question. Hint:
You may also need some of these numpy functions: diff,
max, min,
abs.
- The manual page for the numpy function ravel is here.
- Note that if your answer is 2.824 then you probably have forgotten
that we are looking for the largest decrease, i.e. you need to
ignore the increases.
- Each year, the sea ice extent peaked in a certain half-month. Which
half-month was the annual peak most frequently found?
- Note that you can get a good guess of what the answer is from the
plot.
- Hint: These numpy functions
will be useful argmax,
unique. For the numpy function unique,
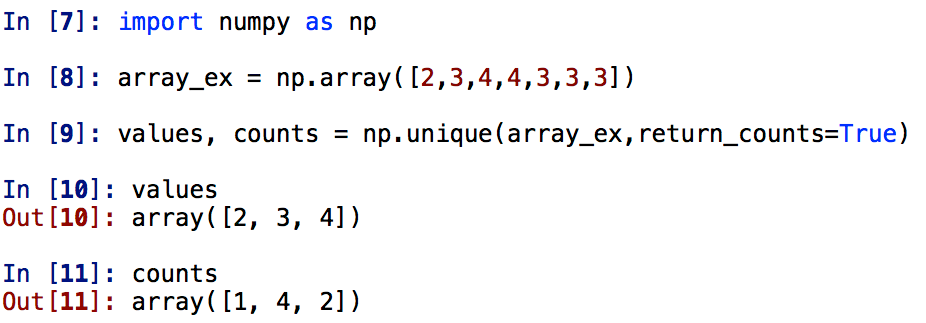
if you use it with the two outputs and the option return_counts=True
then you can get the frequency of occurrence. See the following
example.
At the End of the Lab
You
should be able to show your tutor the exercises. You should be comfortable
with using: Python file processing; numpy broadcasting, indexing.
Finally,
do not forget to complete your online multiple choice question if you have
not done it yet.
If
you have completed everything, please do not forget to logout. Simply
double click on the "Log Out" icon